
This week’s Member Note is the first in a series of guest commentary by Bill McBride, whose Calculated Risk Blog is one of the most prolific and educational sources of housing data and analysis online. Once a month, we will publish one of Calculated Risk’s blogs or co-write one with him. We hope that you find this new addition as useful as we do.
It is clear that over the next year house price growth will slow from the torrid 20% year-over-year (YoY) pace in February (and likely also in the March report that will be released later this month). I think there are three likely scenarios going forward for house prices that I’ll call “slow”, “stall” and “bust”.
First, last year I asked What could cause inventories to increase? and I noted Richard Feynman’s comment about science (1 Minute video here):
“First, we guess … Then we compute the consequences of the guess … to see what it would imply and then we compare the computation results to nature or we say compare to experiment or experience, compare it directly with observations to see if it works.
“If it disagrees with experiment, it’s wrong. In that simple statement is the key to science. It doesn’t make any difference how beautiful your guess is, it doesn’t matter how smart you are who made the guess, or what his name is … If it disagrees with experiment, it’s wrong. That’s all there is to it.”
I take the same approach to making housing predictions. First, I make some guesses as to what will happen (I tell myself some stories), and then I see if it fits the data. If the data doesn’t fit the story, the guess is wrong.
So, these are just guesses – and the data will tell us which (if any) are correct.
Slow, Stall or Bust
My definition of “slow” house price growth will be annualized growth in the mid-single digits. For the “stall” scenario, this will be close to no change (seasonally adjusted, annualized) in house prices. And for the “bust” scenario, this would be house prices declining over the next few years.
The “bust” scenario would be nothing like the decline in house prices following the housing bubble. Following the bust, house prices declined about 26% nationally from the peak (according to Case-Shiller), and significantly more in some cities. For example, prices declined 60% in Las Vegas, and over 50% in Phoenix and Miami following the bubble. In the housing bust, prices fell for several years due to the large number of distressed sales (foreclosures and short sales). We will not see cascading price declines this time since lending standards have been solid.
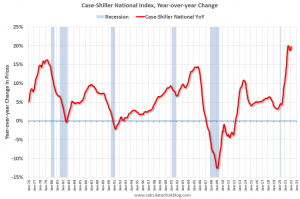
The following graph shows the year-over-year change in the Case-Shiller National Index (Seasonally Adjusted) since 1976. We can see the recent sharp increase in prices.
Also note that house prices stalled in 1982 and in 1991. In 1982, prices declined about 1% from the peak, and in 1991, prices declined about 3% from the peak. I’d consider both of those periods to fit the stall scenario.
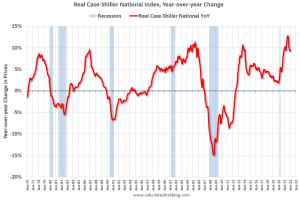
Now let’s look at the year-over-year change for the same period in real terms (inflation adjusted using CPI-less shelter).
Note that in real terms, house prices declined during the stall periods in 1982 and 1991. In the early ‘80s, real prices declined 11% from the peak, even though nominal prices only declined slightly. Homeowners are only concerned with nominal prices, so they didn’t notice the real price decline.
In the early ‘90s, real prices decline almost 14% even though nominal prices declined 3%. Note that real prices were flat for several years in the mid-‘90s.
During the housing bust, real prices declined 35% compared to a 26% decline in nominal prices (this was a low inflation period).
House prices tend to be sticky downwards in nominal terms. Homeowners resist selling for less than the recent sale prices of similar homes in their neighborhood. However, there are always the homeowners that need to sell (death, divorce, moving for employment, etc.), and sometimes these homes will sell for less than previous sales. Note that house prices were not sticky downwards during the housing bust due to the all the forced sales.
However, even in normal times, house prices are not sticky downwards in real terms as the second graph above shows.
A Stall seems Likely
The data seems to argue for the slow house price growth scenario, but my view is the most likely scenario is house prices will stall in nominal terms and decline in real terms. I’ve been looking at the 1978 to 1982 period for lessons, and that would suggest a stall in house prices (hopefully we avoid a recession).
Unfortunately, I don’t have the existing home inventory data for that period. However, my guess is the slow growth scenario would suggest inventory in the 4 to 5 months range, and the stall scenario would be close to 6 months of inventory. For the bust scenario, my guess is we’d see existing home inventory at 7+ months.
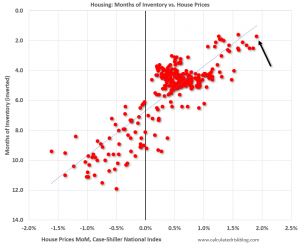
My view on house price growth vs. month-of-supply is based on the graph below that shows existing home months-of-supply (inverted, from the NAR) vs. the seasonally adjusted month-to-month price change in the Case-Shiller National Index (both since January 1999 through February 2022).
There is a clear relationship. If months-of-supply is high, prices decline. If months-of-supply is very low (like now), prices rise quickly.
In February, the months-of-supply was at 1.7 months, and the Case-Shiller National Index (SA) increased 1.90% month-over-month. The black arrow points to the February 2022 dot.
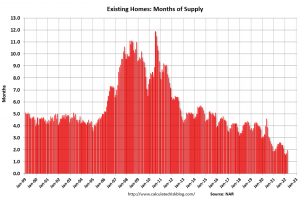
The following graph shows months-of-supply since 1999 (not seasonally adjusted). As of March, months-of-supply was at just 2.0 months according to the NAR. Although inventory is now increasing year-over-year, and sales are declining, we are still a long way from even 4 months-of-supply (slow house price growth scenario).
To get close to 6 months-of-supply (likely needed for stall scenario), we’d probably have to see both an increase in active inventory and a decrease in sales.
In March, the NAR reported sales of 5.77 million SAAR, and inventory of 950 thousand units. That gives 2.0 months-of-supply. If inventory doubles to 1999 levels, sales will have to decline to around 4.0 million SAAR to reach 6 months-of-supply. And that level of sales seems unlikely.
If sales decline to 5.0 million SAAR, inventory would have to increase to around 2.5 million units to reach 6 months-of-supply. This also might seem unlikely and would seem to argue for the slow house price growth scenario; however, I think there are reasons we might sales decline to around 5 million SAAR. We could see a wealth effect from the recent decline in the stock market and speculative assets. Also, my suspicion is household formation will slow (I think there was a sharp increase in household formation in 2021 that will slow later this year). See The Household Mystery.
For new homes, the stall scenario would suggest inventory increasing to well over 8 months (currently new home inventory is at 6.4 months). This seems possible.