
Housing affordability will continue to worsen through this year as inventory remains at historic lows. In fact, excluding the housing bubble of 2004-2008, it is the worst affordability since 1989. This time, there are two important differences that make the current trends somewhat unique. During the early 1980s, homes were unaffordable due to very high mortgage rates. During the housing bubble, toxic mortgages with teaser rates (usually around 1%) made houses seem more affordable. But when teaser rates reset to market levels, many of these mortgages failed because homeowners could not afford the actual cost of the mortgage. Today, soaring housing costs are driven by the compounding impact of apparent underproduction between 2008 and 2020, housing supply chain failures since 2020, and increased demand since 2020.
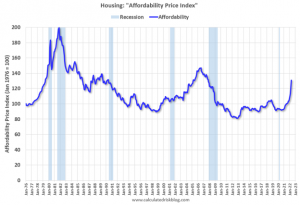
Currently mortgage rates are close to 6.0% – so we already know the “Affordability Price Index” will increase further over the next couple of months (meaning houses are even less affordable).
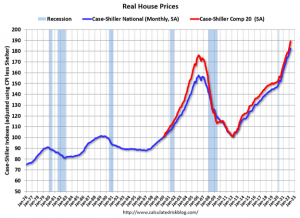
It has been over 16 years since the bubble peak. In the most recent Case-Shiller release, the seasonally adjusted National Index (SA), was reported as being 63% above the bubble peak in 2006. However, in real terms, the National index (SA) is about 16% above the bubble peak (and historically there has been an upward slope to real house prices).
People usually graph nominal house prices, but it is also important to look at prices in real terms (inflation-adjusted). As an example, if a house price was $200,000 in January 2000, the price would be over $330,000 today adjusted for inflation (65%). This graph shows the monthly Case-Shiller National Index SA, and the monthly Case-Shiller Composite 20 SA (through April) in nominal terms as reported.
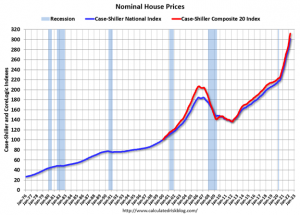
In nominal terms, the Case-Shiller National index (SA) and the Case-Shiller Composite 20 index (SA) are both at new all times highs (above the bubble peak). The National Index is 63% above the bubble peak, and the Composite 20 index is 51% above the bubble peak.
The next graph shows the same two indexes in real terms (adjusted for inflation using CPI less Shelter). In real terms, house prices are now above the previous peak levels. There is an upward slope to real house prices, and it has been 16 years since the previous peak, but real prices appear historically high (Of course interest rates had been very low).
Price-to-Rent Ratio
In October 2004, Fed economist John Krainer and researcher Chishen Wei wrote a Fed letter on price to rent ratios: House Prices and Fundamental Value. Kainer and Wei presented a price-to-rent ratio using the OFHEO house price index and the Owners’ Equivalent Rent (OER) from the BLS.
Note that OER is lagging behind other measures of recent rent increases.
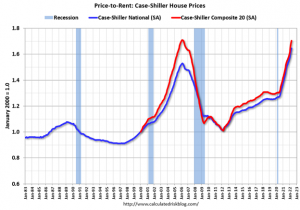
On a price-to-rent basis, the Case-Shiller National index is at a record high, and the Composite 20 index is back to peak levels in early 2006.
By all of the above measures, house prices appear elevated.
Two years ago (in 2020) inventory was declining all year, so the two-year comparison will get easier all year. Based on recent increases in inventory, my current estimate is inventory will be up compared to 2020 in Q3 of this year (in the next few months), and back to 2019 levels at the beginning of 2023.
If that’s not complicated enough, we must also consider whether construction is permitted but not started, under construction, or complete. This graph shows the three categories of inventory starting in 1973.
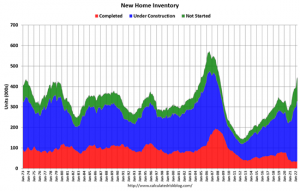
The inventory of completed homes for sale – at 37 thousand – is up from the record low of 32 thousand in 2021 and early 2022. This is about half the normal level of completed homes for sale.
The inventory of homes under construction at 292 thousand is very high, and about 10% below the record set in 2006. The inventory of homes not started is at a record 115 thousand.
The next graph shows the months of supply by stage of construction. “Months of supply” is inventory at each stage, divided by the sales rate.
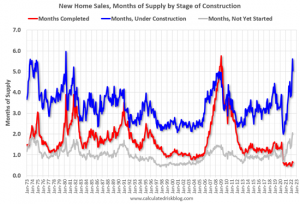
There are just over 0.68 months of completed supply (red line). This is about half the normal level. The inventory of new homes under construction is at 5.0 months (blue line) – well above the normal level. This elevated level of homes under construction is due to supply chain constraints. This is close to the record set in 1980. And a record 115 thousand homes have not been started – about 2.0 months of supply (grey line) – almost double the normal level. Homebuilders are probably waiting to start some homes until they have a firmer grasp on prices and demand. Rising interest rates could play a significant role in determining demand and reduce housing starts, which would contribute to keeping inventory low.
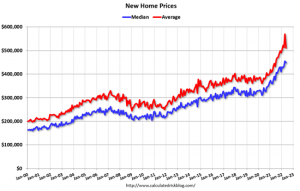
All of these factors work together to drive up home prices and reduce affordability. The median sales price of new houses sold in May 2022 was $449,000. The average sales price was $511,400.
The following graph shows the median and average new home prices. The average price in May 2022 was $511,400 up 15% year-over-year. The median price was $449,000 up 15% year-over-year. This might suggest a slowdown in price increases.
The last graph shows the percent of new homes sold by price.
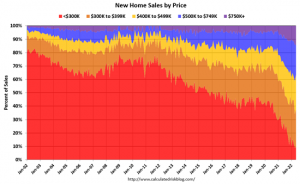
Only 9% of new homes sold were under $300K in May 2022. This is down from around 80% in 2002. In general, the under $300K bracket is going away (inflation has pushed prices higher).
There has been a sharp increase in the percent of homes over $500K since the beginning of the pandemic. In early 2020, about 17% of new homes sold were over $500K; in May 2022, 37% were over $500K.
Supply constraints have lengthened the time from start to completion. We can see the impact of supply constraints by looking at the gap between single-family starts and completions. It usually only takes about 6 months between starting a single-family home and completion, but it has taken longer during the pandemic. As long as these conditions persist, we will see upward pressure on home prices.
So it makes sense that through this year, we are likely to see inventory levels improve, though below historic levels. Many of the homes currently permitted may not be built at all. Price increases are likely to ease, but prices will remain at historically high levels. As a result, housing affordability will continue to suffer.