
Refinance activity has all but vanished, and purchase activity is down significantly year-over-year (YoY). This has led to significant layoffs in the mortgage industry. For example, LoanDepot has reduced staff by 35% this year, with further layoffs planned:
“We have already made significant progress … reducing headcount from approximately 11,300 at year-end 2021 to approximately 8,500 at the end of June 2022, to approximately 7,400 at the beginning of August 2022. We are accelerating our execution of the plan and expect to end the third quarter of 2022 with headcount below our previously stated year-end goal of 6,500.”
However, this will not be like the lender implosion following the housing bubble, since the quality of recent loans – and the structure of the industry – is very different from the bubble years. The Mortgage Bankers Association’s (MBA) refinance index is near its lowest level since the year 2000.
Inventory is Housing’s Crystal Ball
The NAR reported inventory was up 2.4% year-over-year in June. Other sources, such as Altos Research and Realtor.com, indicate active inventory is currently up 30% YoY.
The early local market reports for July show inventory up over 46% YoY for these markets! These same markets were up 20% YoY in May, so the NAR report for July will show further increases in inventory.
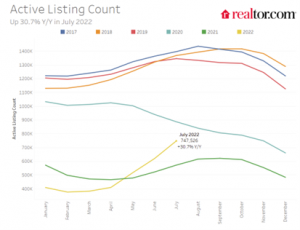
It is important to realize inventory is both increasing and still very low. Here is a graph from Realtor.com’s July Housing Trends Report. This shows their estimate of active inventory over the last six years. Currently inventory is rising, but still far below normal.
Since inventory was declining rapidly for most of 2020, and it is very likely that inventory will be up in August or September compared to 2020.
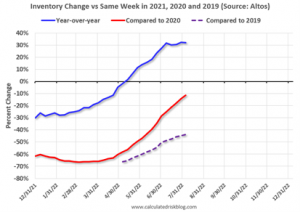
Here is a graph using the Altos inventory data of the trend comparing to 2019, 2020 and 2021. The blue line (compared to 2021) shows inventory is up YoY, but growth has slowed recently.
The red line compares to 2020, and inventory will be up compared to 2020 by September. The dashed purple line is compared to 2019, and this will be the key comparison for inventory.
For new homes, there are a record 6.2 months of homes under construction – well above the normal level (total inventory is at 9.3 months, but that includes homes not started). This elevated level of homes under construction is due to supply chain constraints. However, there are still very few completed homes for sale.
And for housing starts there are a record 1.665 million units under construction. This eclipses the previous record of 1.680 million units that were under construction (mostly apartments in 1973 for the baby boom generation).
House Prices
Reported house price growth is still very strong, but the Case-Shiller National Index has started to show a slight deceleration to 19.7% in May. The recent slowdown will take some time to show up in the price indexes, see: When will House Price Growth Slow?
The Case-Shiller index is a three-month average of closing prices, so “May” prices are for sales that closed in March, April and May. A few of those contracts were probably signed in January!
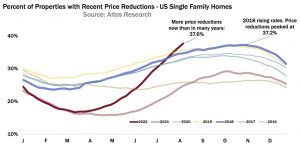
We have to be patient waiting to see the impact on house prices of the slowdown in sales due to the significant data lags. Meanwhile, Altos Research CEO Mike Simonsen noted this week that “prices reductions” are above normal. And he expects 40% of properties will see price reductions by September.
Here is my outlook for house prices: What will Happen with House Prices?
Sales
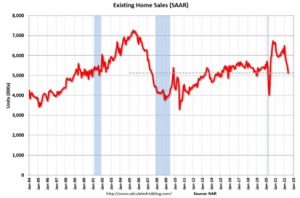
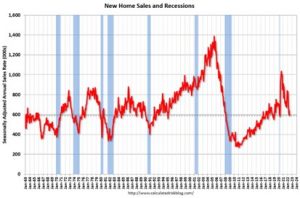
We are seeing declines in both new and existing home sales due to higher mortgage rates. The NAR reported sales in June were at “a seasonally adjusted annual rate of 5.12 million. Year-over-year, sales dropped 8.6% (from 5.92 million in June 2021).
Sales that closed in June were likely signed in April and May, and with higher mortgage rates in June, I expect sales to decline further in July. The local market reports released so far suggest a further significant decline in closed sales in July.
And the Census Bureau reported “Sales of new single?family houses in June 2022 were at a seasonally adjusted annual rate of 590,000”, down 17.4% from June 2021.
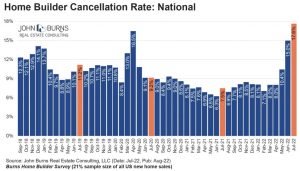
It is important to note that the Census Bureau reports gross sales, whereas the homebuilders report net sales (gross sales minus cancellations). Usually this isn’t a big difference, but during periods of rising cancellations, gross sales is too high. See: New Home Sales and Cancellations
Earlier this week, Rick Palacios Jr., Director of Research at John Burns Real Estate Consulting tweeted that new home cancellations have increased sharply in July.
July builder vibes in one chart.
Conclusions
We are seeing a sharp slowdown in the housing market, with more price reductions, more inventory, and fewer sales. It will take some time to see the impact on house price growth, but that is coming too. However, inventory growth has slowed recently, and inventory is key for predicting house prices.
Next week, existing home sales will likely show a sharp year-over-year decline in sales for July – with sales below 5 million SAAR for the first time since the first few months of the pandemic. Housing starts will probably show further declines (and still a record number of homes under construction).
It is important to remember that housing is a key transmission mechanism for Federal Open Market Committee (FOMC) policy. As long as inflation remains elevated, the Fed will keep raising rates – and that will impact the housing market (although mortgage rates have already jumped in anticipation of the FOMC actions).
Bill McBride is the author and creator of the Calculated Risk Blog and is a periodic contributor to the NHC Member Brief.