

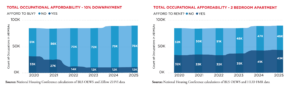
Washington, D.C., October 7, 2026 – Workers with good jobs are increasingly being priced out of homeownership across the country, according to new research from the National Housing Conference (NHC). In 2025, only 14% of the occupations across hundreds of metro areas analyzed could afford a typically priced home with a 10% down payment, according to NHC’s Priced Out: When a Good Job Isn’t Enough report. The annual study examines how the widening gap between wages and housing costs is reshaping affordability for nearly 300 occupations across 390 metropolitan areas.
The findings show how sharply housing affordability has deteriorated in just five years. The research tracked affordability across thousands of pairings of occupation and metro area — for example, “registered nurse in Phoenix” or “teacher in Cleveland.” In 2020, workers could afford homeownership in 32,794 of these pairings; by 2025, that number had fallen to just 12,189, a loss of 20,605. The income squeeze was even more extreme in 188 of 372 metro areas with available five-year data where workers now need at least twice the income they needed in 2020 to buy a typically priced home.
“Homeownership is slipping beyond the reach of America’s workforce,” said David M. Dworkin, President and CEO of NHC. “When people with good jobs can no longer afford to live in the communities where they work, we do not just have a housing problem—we have a much broader economic problem. Housing is the foundation of financial security, workforce stability, and strong local economies.”
The affordability crisis is not limited to lower-wage workers. The average annual salary among occupations that lost the ability to purchase was $70,283. The number of metropolitan areas requiring an annual salary above $100,000 to afford a typically priced home rose to 193 in 2025, compared to 30 in 2019.
Renters are also losing ground. In 2025, 45,833 occupation–metro combinations could afford a two-bedroom apartment without being cost-burdened, 5,989 fewer than in 2020. Nearly half of the tracked occupation–metro combinations could not afford a two-bedroom rental in 2025, and 38 metropolitan areas required an annual salary above $75,000 to do so.
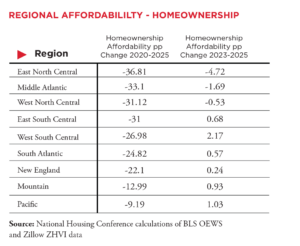
The loss-of-affordability data show the breadth of the damage. Nationally, the share of occupations able to afford homeownership fell over 25 percentage points from 2020 to 2025. The East North Central region experienced the steepest decline at 36.81 percentage points, followed by the Middle Atlantic (33.10), West North Central (31.12), and East South Central (31.00). Although the national measure declined by only 0.28 points from 2023 to 2025, the five-year affordability gap remains substantial.
A Closer Look
Metro-level data show some of the largest five-year homeownership affordability losses in Syracuse, N.Y. (53.00 percentage points); Mansfield, Ohio (52.13); Hinesville, Ga. (51.84); and Erie, Pa. (50.88). From 2023 to 2025, the sharpest recent losses included Midland, Mich. (15.06 percentage points); Syracuse, N.Y. (14.95); Springfield, Ohio (13.48); Toledo, Ohio (12.05); and Rockford, Ill. (11.61).
State-level data illustrate how differently the affordability crisis is playing out across the country.
In Georgia, the average annual income needed to purchase a typically priced home rose 113%, from $42,418 in 2020 to $90,644 in 2025, while average occupational salaries increased 27.3%. In Hinesville, the share of tracked occupations able to purchase fell from 59% to 8%.
Ohio recorded the largest statewide loss in homeownership affordability, a 40.97 percentage point decline from 2020 to 2025. In Mansfield, the share of tracked occupations able to buy fell from 82% to 30%; in Columbus, it fell from 40% to 9%.
Colorado offers an early sign that affordability can improve. After five-year affordability losses, the state recorded gains from 2024 to 2025 of 1.98 percentage points for homeownership and 1.56 points for two-bedroom rentals. Nineteen occupations that could not afford to purchase in 2024 regained that ability in 2025 across several Colorado markets.
“Housing policy is economic policy,” said Dworkin. “A community cannot function when the people who teach its children, care for its patients, build its homes, and respond to emergencies cannot afford to live there. We must build and preserve more homes near jobs, remove unnecessary costs and delays, and bring federal, state, and local resources together to expand supply at the scale this crisis demands.”
NHC’s analysis draws on its Paycheck to Paycheck database, which combines occupational wage data from the Bureau of Labor Statistics, typical home values from Zillow, and Fair Market Rents from the U.S. Department of Housing and Urban Development. The database compares annual wages and housing costs for nearly 300 occupations across 390 metropolitan statistical areas, showing where workers can—and cannot—afford typical housing. To see how rising costs are affecting your community, visit the Paycheck to Paycheck database at www.nhc.org/paycheck-to-paycheck.
NOTE TO EDITORS AND REPORTERS: NHC can provide customized data and analysis for your metropolitan area.
###
About the National Housing Conference (NHC): Founded in 1931, the National Housing Conference is the oldest and broadest housing coalition in America. NHC is a diverse continuum of affordable housing stakeholders who convene and collaborate through dialogue, advocacy, research, and education, to develop equitable solutions that serve our common interest—an America where everyone is able to live in a quality, affordable home in a thriving community. Politically diverse and nonpartisan, NHC is a 501(c)3 nonprofit organization. To learn more about NHC, visit www.nhc.org.